Technical Paper Title: Satellite-Based Tsunami and Earthquake Early Warning System
Authors: CH.SANDHYA & M.ARPITHA, 2nd BTech, CSE
College: Sai Spurthi Institute of Technology, Sathupalli, Khammam
Abstract:-
A satellite-based communication system is introduced to give early warning of tsunamis and earthquake by direct measurement of tsunamis in the open ocean and s-waves followed by real-time reporting to warning centers. This alert system for tsunami and earthquakes transmits their magnitude values to a central place via satellite communication to deliver alert signals. The tsunami alarm system consists of bottom pressure recorder (BPR) that can record seismic waves followed by tsunami waves and transfer this data to the warning dissemination centre through satellite communication media. The earthquake alarm system consists of reporting terminal which is very similar to the tsunami reporting terminal, except that an accelerometer is used in place of the Bottom pressure recorder. After receiving warning a prerecorded or instantly-recorded, siren appended with voice/text messages is transmitted to the warning receivers, placed in different locations, using a common satellite channel.
Introduction:-
Our country recently witnessed the havoc played by tsunami. This natural phenomenon showed to the world the raw and untamed power of nature. Very few people knew about tsunami until it struck. Even those who are involved in this field never thought of tsunami striking in Indian Ocean. And that is the reason why we could not do anything even though we had plenty of time to broadcast alert warning to our coastal areas. The term ‘tsunami’ was adopted for general use in 1963 by an international scientific conference. Tsunami is a Japanese word made of ‘tsu’ and ‘nami’ characters where ‘tsu’ means ‘harbour’ and ‘nami’ means ‘wave’. Also in the past, the scientific community referred to tsunamis as ‘seismic sea waves’. ‘Seismic’ implies an earthquake-related mechanism of generation. Although tsunamis are usually generated by earthquakes, these are less commonly caused by land slides, infrequently by volcanic eruptions and very rarely by a large meteorite impact in the ocean.
Since a tsunami wave has a very large wavelength, it will lose little energy as it propagates. Hence in very deep water, the tsunami wave will travel at high speeds and travel great transoceanic distances with limited energy loss. For example, when the ocean is 6100 meters deep, unnoticed tsunamis travel around 890 kmph the speed of jet airplane. And they can move from one side of the Pacific Ocean to the other side in less than one day.
As the depth of water decreases, the speed of the tsunami diminishes, but the change in total energy of the tsunami remains constant. Therefore as the tsunami wave enters shallower water, the height of the wave grows. Because of this ‘shoaling’ effect, a tsunami that was imperceptible in deep water may grow to be several meters in height.
Earth quake (seismic) waves
When an earthquake occurs, it releases energy in the form of waves that radiate from that earthquake source in all directions. Different types of energy waves shake the ground in different ways and travel through the earth at different velocities.
The fastest wave is called the primary wave or p-wave. Like sound wave, this is compression in nature. It compresses and expands material in the direction it is traveling. P-waves move at the rate of 8 km per sec. These move the earth up and down perpendicular to the direction of their motion. S-waves are slower than p-waves and move at half the speed of p-waves i.e., km ps. Vertical ground motion generated by s-waves is highly damaging to the structures.
Fig 1 shows recording of both the p and s waves.
Most structural damage occurs due to slower surface waves called love and ray Leigh; these waves shake the ground horizontally perpendicular to the direction of motion. Destruction also depends on the frequency of ground vibrations. P and S waves have a higher frequency of vibration, which shakes low rise buildings.
Locating an epicenter
U needs a seismogram from 3 different seismic stations (See fig 3). Examine the seismograph and determine the elapsed time between the arrival of the first p wave and the1st S-wave. Knowing the s-p time, u can determine the distance to the epicenter from the seismic station using the time distance graph. (See fig 2) On a map, draw around the seismic station a circle with a radius equal to the distance to the epicenter. Repeat for other 2 seismic stations. The point where the circles meet is the epicenter.
Magnitude of an earthquake
The equation for Richter magnitude is:
ML=log10A (mm) + Distance correction Factor
Where ‘A’ is the amplitude in millimeters, measured directly from the photographic paper record of the Wood-Anderson seismometer –a special type of instrument. Thus after you measure the wave amplitude, you have to take its logarithm and scale it according to the distance of the seismometer from the earthquake, estimated by the s-p time difference. The s-p time, in seconds, makes delta. Measure the distance between the first p wave and the first save. In this case, the first p and s waves are 24 seconds apart. Find the point for 24 seconds on the left side of the chart shown in fig 4 and the mark that point. According to the chart, this earthquake’s epicenter was 215 km away.
Measure the amplitude of the strongest wave. The amplitude is the height of the strongest wave. On this seismogram, the amplitude is 23 mm. Find 23 mm on the right side of the chart and mark that point. Place a ruler on the chart between the points you marked for the distance to the epicenter and the amplitude. The point where your ruler crosses the middle line on the chart marks the magnitude of the earthquake. This earthquake had a magnitude of ‘5’.
Tsunami waves
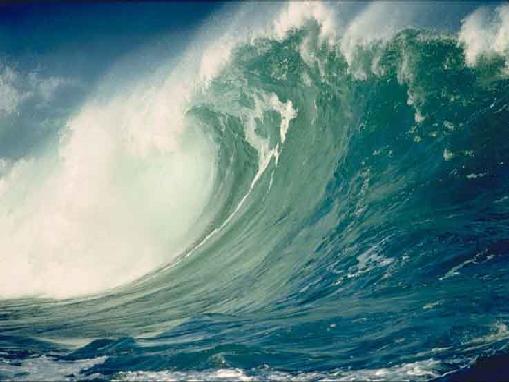
A tsunami is a series of ocean waves generated by a rapid, large-scale disturbance of the sea water, associated primarily with earthquakes occurring below or near the ocean floor or much less frequently by volcanic eruptions, landslides, undersea slumps and meteor impact. Tsunamis can propagate across whole oceans; distinguishable only by their great length from crest to crest, which may be up to 100 km, with the duration between successive peaks being anything from five min to an hour. This creates a sea surface slope so gentle that the wave usually passes unnoticed in deep water. As tsunami enters the waters of coastlines, the velocity of its waves diminishes and wave height increases.
Typically, the most damage is sustained near the source as waves are at their near the source as waves are at their highest as little energy is lost due to friction or spreading. The velocity of waves varies from 300 to 800 km/hour, with height up to 10 m or more depending on the intensity of the earthquake. As the waves move up and down, the mean pressure on the bottom of the sea, due to the change in the volume of water on a particular point, also changes.
Tsunami alarm system
From the above text, it is clear that two types of waves are generated; seismic surface waves that induce vertical motion of the sea floor and tsunami waves that cause displacement of the sea surface. Both the waves can be recorded by a special type of equipment called bottom pressure recorder (BPR) deployed at the bottom of the ocean.
The waves are represented as one of the two distinct packets of energy as shown in fig 5. The first packet is composed of the seismic waves that traveled at 11,000 km/hour to arrive at the PR only minutes after the event. The second packet shows the tsunami waves that traveled at 800 km hour to arrive 70 minutes after the earthquake.
Bottom pressure recorder
The Pacific Marine Environmental Laboratory (PMEL) has developed a bottom pressure recorder (BPR) that can record seismic waves followed by tsunami waves. This BPR is being used for the deep-ocean Tsunami observation in Pacific Ocean project.
The BPR can function on long-term deployments under sea and accurately measure tsunamis with amplitudes as small as 0.5 cm in water depth up to 6 km. The recorded amplitudes of the seismic surface wave (fig 5) are greatly exaggerated by acceleration forces but this record clearly demonstrates the ability of the BPR to measure the first arriving waves and the following tsunami. Ships and storm waves are not detected because their length is short, and as with currents, changes in pressure are limited to the upper layers of overlying water.
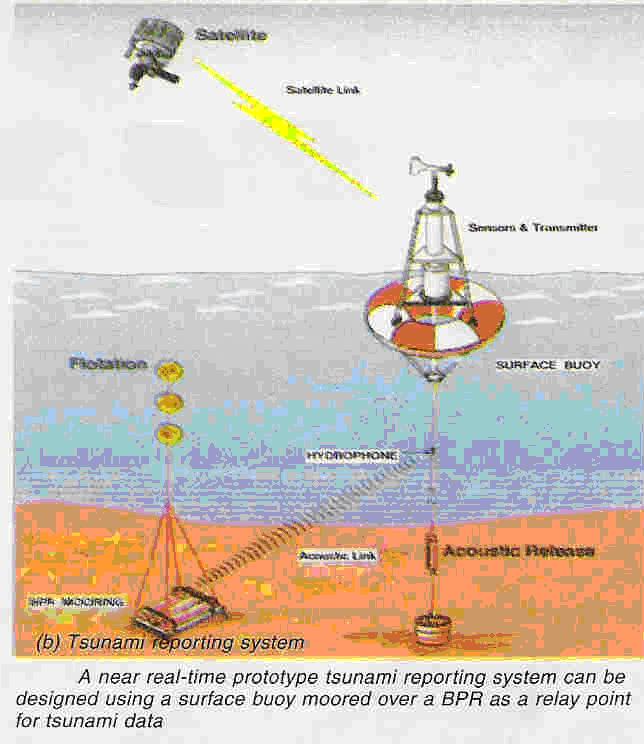
The BPR has low-power digital signal processing capabilities and acoustic modems to communicate with the satellite communication unit (SCU) on surface buoy.
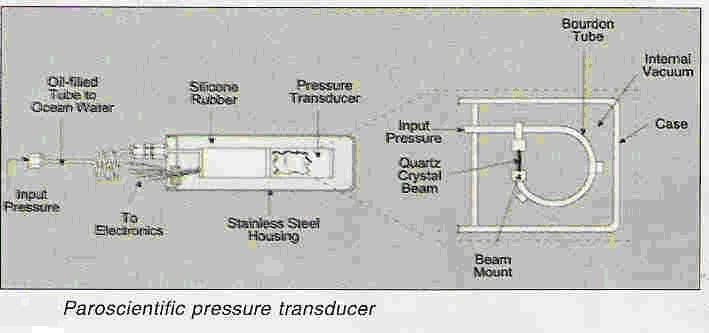
The tsunami bar uses a pressure transducer manufactured by par scientific, Inc. (see fig 6). The transducer uses a very thin quartz crystal beam, electrically induced to vibrate at its lowest resonant mode. This oscillator is attached to a bourdon tube that is open on one end to the ocean environment.
As a tsunami wave crest passes over the instrument, the increased pressure causes the bourdon tube to uncurl, stretching the quartz crystal and increasing the vibrational frequency. Conversely, the passage of a tsunami trough reduces the pressure, allowing the bourdon tube to curl more tightly, there bye compressing the quart crystal and lowering the vibrational frequency.
Real-time tsunami reporting system:
The main function of the tsunami reporting system is to record seismic waves followed by tsunami waves and transfer this data to the warning dissemination center through satellite communication media.
A near real-time proto type tsunami reporting system can be designed using a surface buoy moored (see fig 7(a) & (b)) over a BPR as a relay point for tsunami data. It is not practical for various reasons to make an electrical connection from the sea floor to the surface to transmit data. One of the reasons is the continuous circular movement and change in directions of the surface buoy due to wind and waves.
The satellite communication unit works at a low information bit rate using helix/patch antenna and binary phase-shift keying (BPSK) modulation. The transmit frequency lies in s-band and the channel access schemes used are ALOHA and TDMA. Messages up to 40 characters long can be transmitted in burst mode and the total time of each burst is 1.68 sec.
Working of tsunami warning system:
An array of reporting systems (as shown in fig 7) is to be deployed in the Indian Ocean such that it covers the entire coastal areas. A large number of reporting systems will give near real-time and accurate direction of killer waves. However, this will also increase the cost and maintenance of the total system.
Functioning of the system begins with the detection of an earthquake, which has a magnitude and location that make it potentially capable of generating a tsunami. When the earthquake occurs, it generates seismic surface waves (SSWs) that travel in all the BPR’s one by one. The BPR nearest to the epicenter will be struck first.
Once a BPR detects SSWs, it will start transmitting this data to the warning centre through the satellite communication unit and start frequently monitoring and transmitting the average sea-level data until the sea comes to its normal state because tsunami waves may be more than one Peak level is the height of tsunami wave.
The satellite communication unit adds GPS data to the BPR data as the GPS measures the height of waves, confirming the rise of the sea level, and also helps to interpret the BPR data. But when a GPS can give height of the waves, why the BPR is required? It has been found that some times the surface buoy jumps five to six meters for actual wave height of one meter.
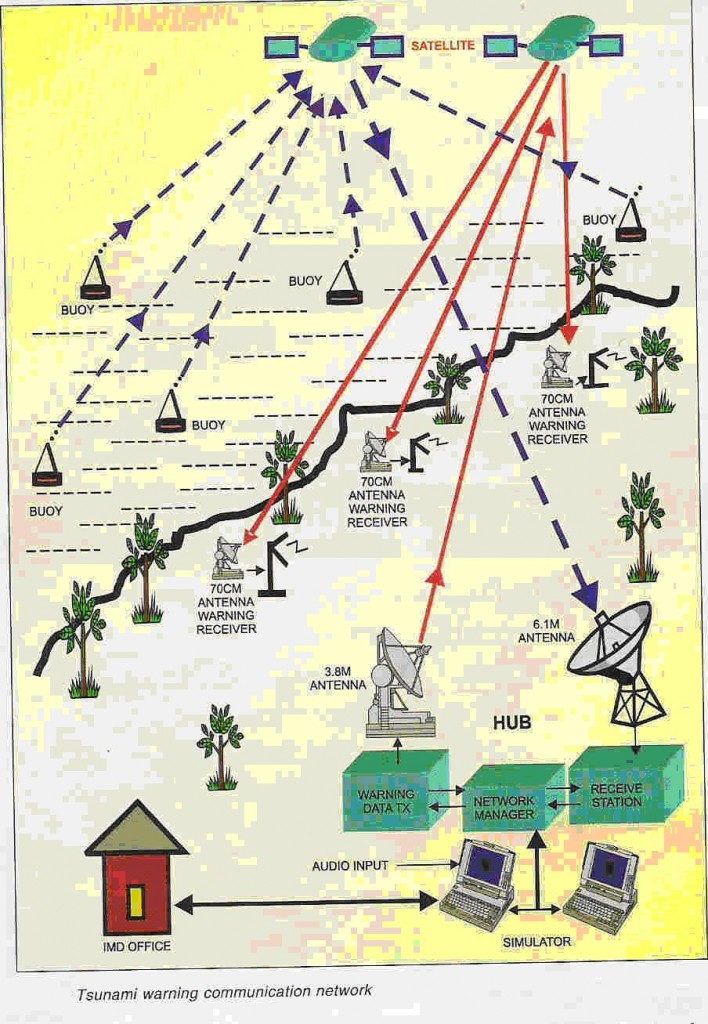
The time between SSWs and tsunami depends on the distance between the epicenter and the reporting terminal. The Indian meteorological department (IMD) continuously monitors earthquake activities through observatory centers deployed in different part of India. On the arrival of SSWs, the warning centre will be continuously in touch with the IMD to find out the location of the epicenter and its magnitude, which takes 15 to 20 minutes.
The total tsunami warning communication network is shown above.
Time to alert for tsunami:
The first example is that of a tsunami occurring in Sumatra. Within three minutes of the start of the earthquake at Sumatra, all the reporting systems will be struck by surface waves one by one. The surface waves will first strike the reporting terminal no. 1, then 4 followed by 1. After that, it will strike at the same time terminal no’s 2 and3, followed by 5 and 6, then 8.
The warning centre will receive all the data one by one and thus know locations of all the reporting terminals. The computer can simulate all the data and find out a rough direction and distance of the epicenter. Here the epicenter may be at point no 1 or away from it. Finding out the exact distance is not possible because of the BPR’s limitation of recording p waves. As reporting terminal no 1 is far away from the Indian coastal areas, the warning centre can wait for 15 to 20 min for confirmation of the location of the epicenter and the magnitude of the earthquake.
Earthquake alarm system:
Whenever an earth quake occurs, most of the casualties are due to structural damage caused by s-waves followed by l and r waves. These waves travel at a speed of 3 of 4 km per second in all directions. A house located 40 to 50 km away from the epicenter of a high magnitude earthquake would therefore be hit by s-wave after 10 to 12 seconds. It will take 10 to 15 seconds to damage the house if it is poorly structured. Therefore, a person gets a total tie of 20 to 25 seconds to go to a sager place if an alarm is raised just 10 seconds before the killer waves hit that house.
Working of the earthquake alert system:
In the event of an earthquake of r-scale magnitude greater than 6, s waves will hit the reporting terminal or terminals nearest to the epicenter. As the wave moves away from the epicenter, it will hit other terminals. The terminals, in turn, will transmit this data to the network manager through the satellite channel.
The network manager automatically selects from the computer the places where warning is to be disseminated, and those would be 40 to 400 km away from the reporting terminal depending on the magnitude of the earthquake. It transmits the prerecorded siren or audio to selected warning receivers stationed 40 to 400 km away from the reporting terminal. The network manager also receives earthquake data from different reporting terminals one by one and that confirms the event of earthquake.
Conclusion:-
The Pacific Marine Environmental Laboratory (PMEL) has developed this technology and it is being used for the project deep-ocean tsunami observation in Pacific Ocean. This single alert system for both tsunami and earthquake senses changes of the water-level pressure on the sea floor caused by tsunami in sea and seismic wave magnitude due to an earthquake on the earth surface. It transmits these discrete magnitude values to a central place via a satellite communication network, and uses computer-based decision making to deliver alert signals to the identified receivers placed at different towns, cities and coastal areas. The system can be configured with the available resources in India. India can also go for the development of such a system with the help of renowned R&D institutions of India.
References:
1. Electronic Communication Systems -WAYNETOMASI—PEARSON EDUCATION
2. Satellite Telecommunication. —SHELDON—TMH.2000
3. EFY MAGAZINE-DEC 2004 EDITION.


